
Why inventory the plants in my garden?
This week I decided to do a botanical inventory of my small home garden. As I understand, knowing what plant species are present and in what amounts is an important metric to track throughout ecological and biocultural restoration projects. I wanted to practice these methods.
I was also just curious to know just how well I knew the what plants were in my garden, especially after a question someone posted in response to my last article. Since I have spent a fair amount of time curating the plants there, I figured I knew it well.
Doing an inventory of my garden would give me practice with basic ecological methods and objective data to compare with my preconceptions. But rather than a pure ecological inventory, I approached it more like an ethnobotanical inventory. My garden has seen a lot of human intervention, so it’s not a “natural” area in that sense. And I assigned each species a name that makes sense to me rather than trying to identify everything to species, another ethnobotanical aspect of the study. I’ll circle back to that last point in a moment.
What I did: protocols and field decisions
First, I had to define the bounds of my garden. I used physical boundaries (two fence lines, the side of the house, and a gravel-concrete border) to define the four sides of my rectangular garden, which measures 25.5 feet x 17.0 feet (433.5 square feet). This includes a rooftop section where I grow some potted plants.
Given the relatively small size of the garden, it was practical to inventory the whole thing instead of sampling portions of it. Thus, my measurements represent a snapshot of the species in my garden at a particular point in time, which I can later use to compare with snapshots from other times.
My measuring protocol was informed by a vegetation protocol I use in FIA (Forest Inventory and Analysis), with some modifications. For each plant species, I approximated leaf cover as rectangles (parallel to the ground) and measured length and width with a standard tape measure. I then used these measurements to calculate total area for each species. This area is independent of spatial overlap with any other species, which means that the total area for all the species can be greater than the area of the garden. I calculated cover proportions by dividing cover area for each species by the total area of the garden.
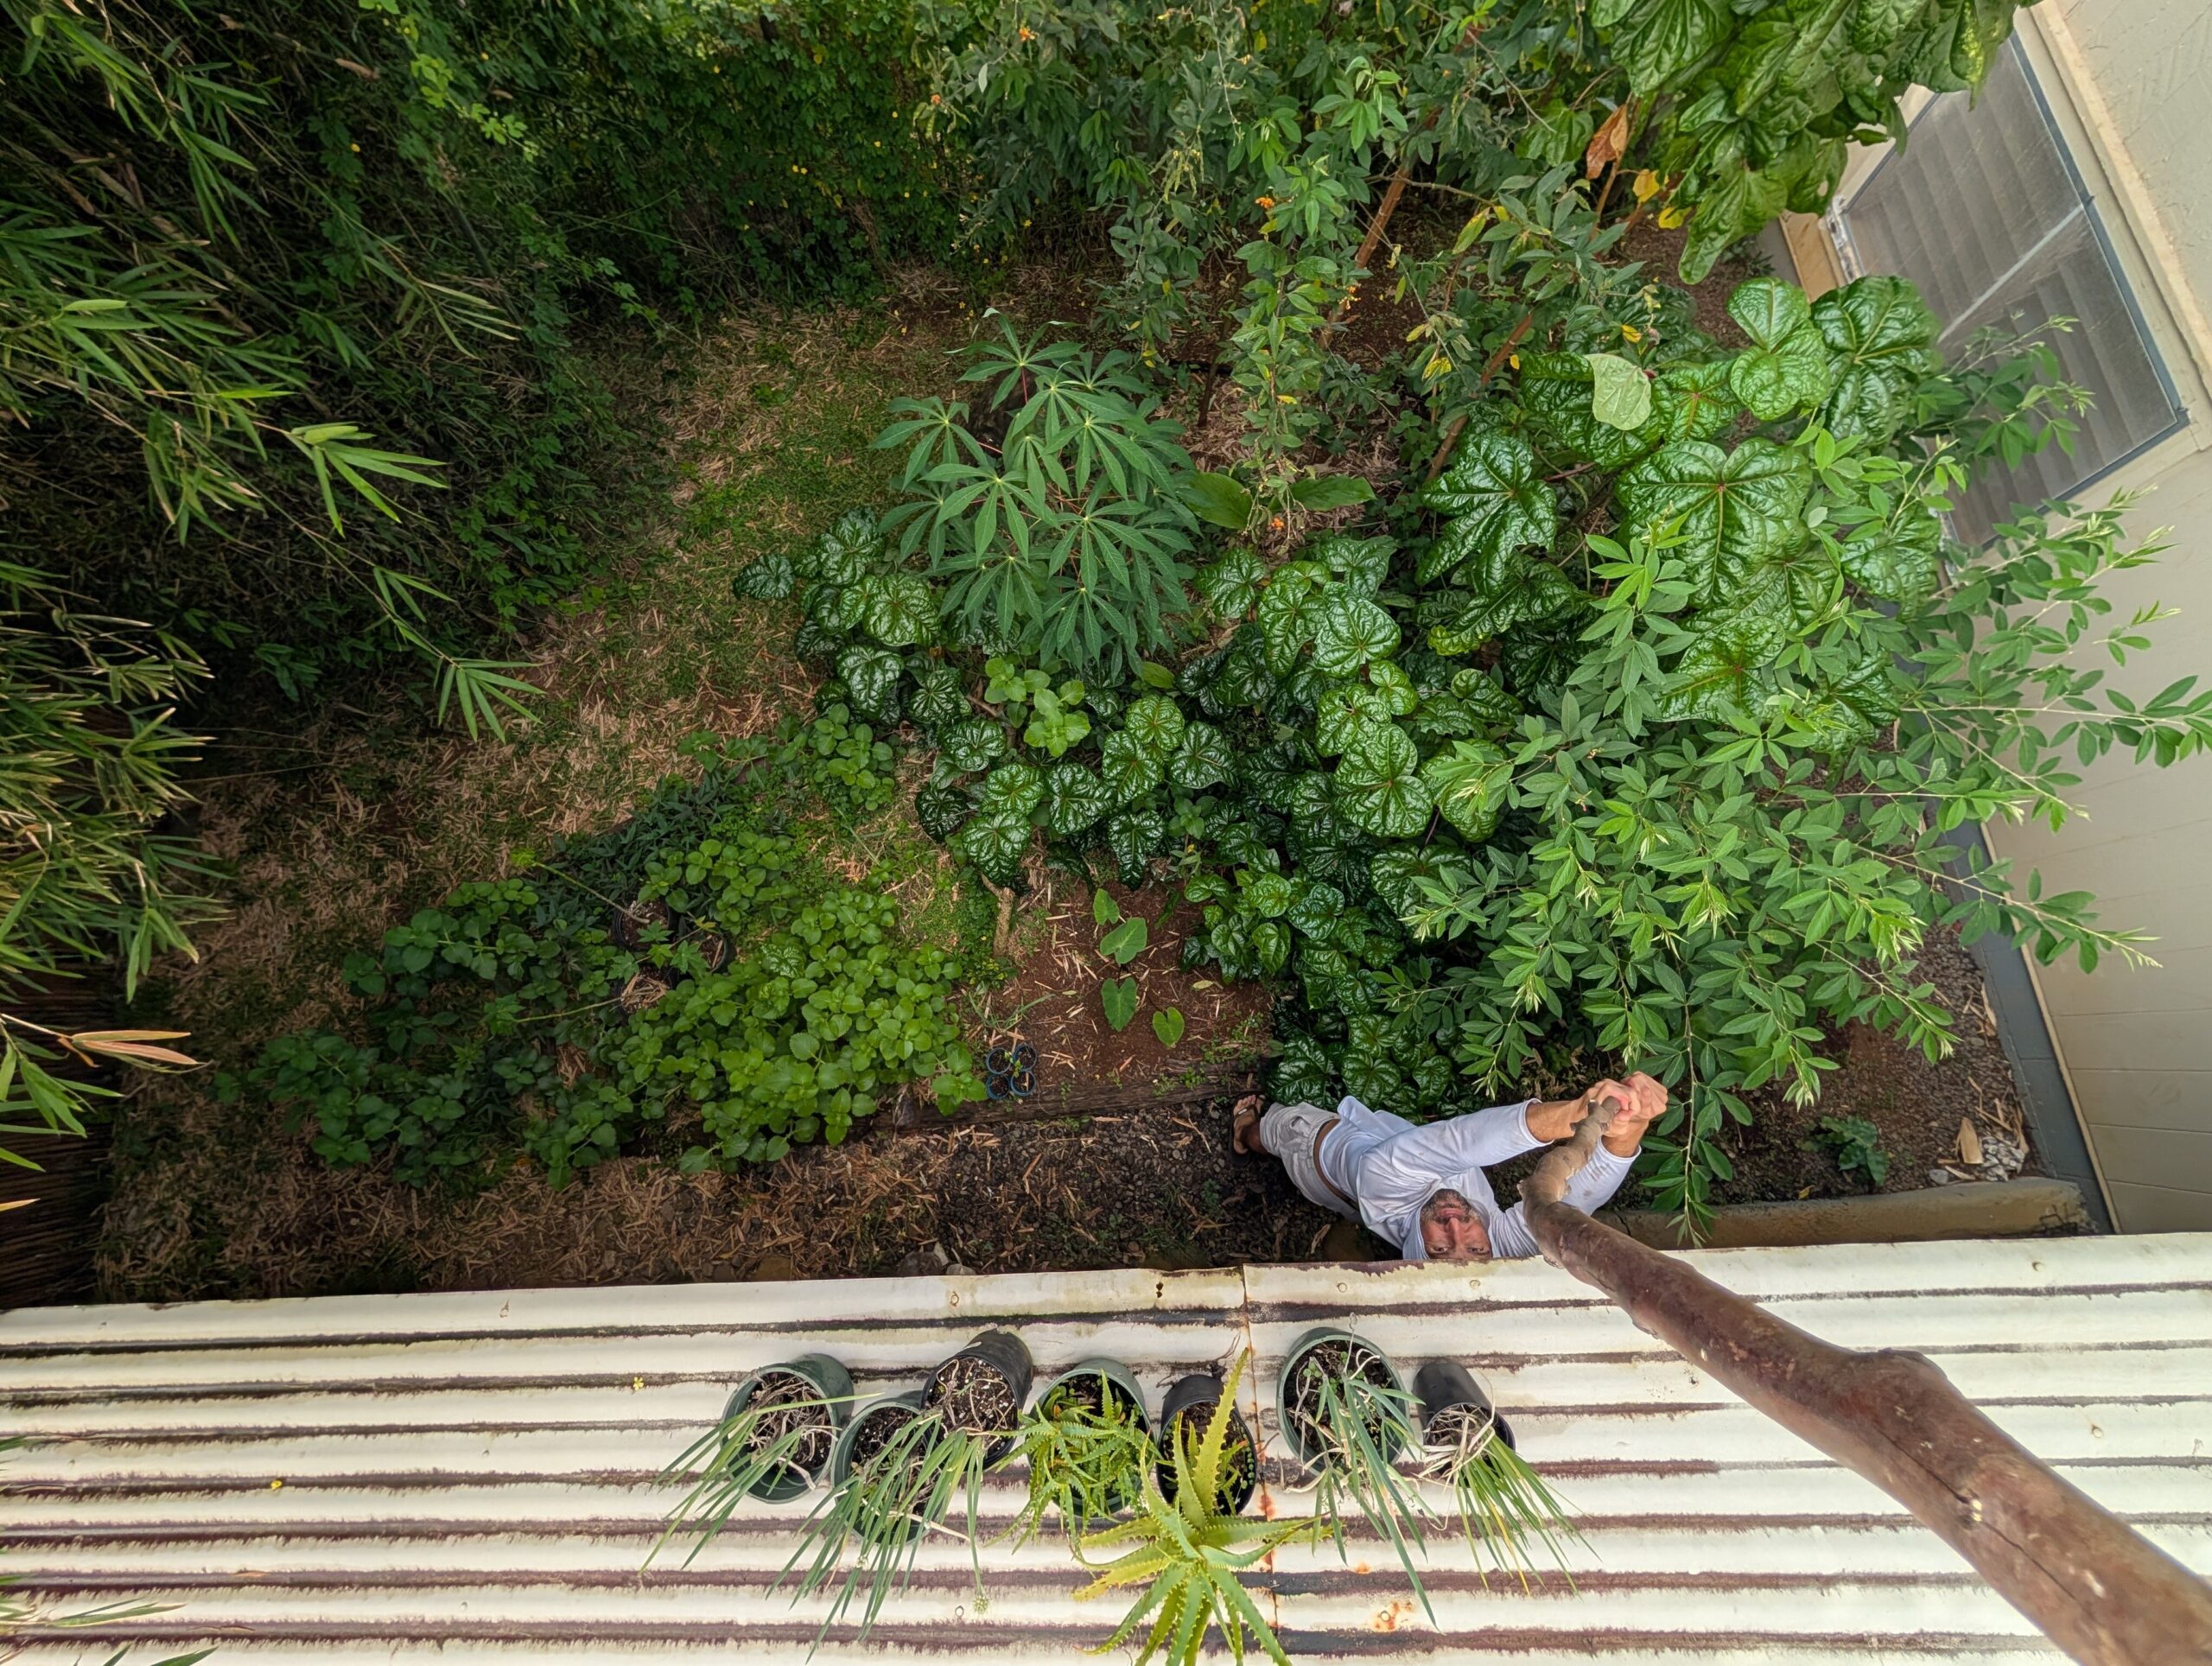
Partway through the measurements, I decided to implement a minimum area cutoff of 0.5 feet x 0.5 feet for any given species. I did this to reduce bias: I was noticing several species that were present in very small amounts, and I wanted to avoid capturing some locally-rare species while missing others. I figured that requiring a minimum area of 0.25 square feet would ensure that I was capturing all species above that threshold. Thirty plant species met this threshold.
I used base R graphics for all figures.
What the data show
To get an overall sense of the data, I plotted cover proportions for each species in a lollipop chart, ordered by cover proportion. For this inventory, I decided to just use the common names by which I know the plants. I mainly wanted to document what was there and how much of it without getting bogged down in species identification. I am confident that I can tell the species apart, even if I don’t know the Latin name, and that’s good enough for now. The idea is that I can go back later and assign Latin names if needed for future analyses.
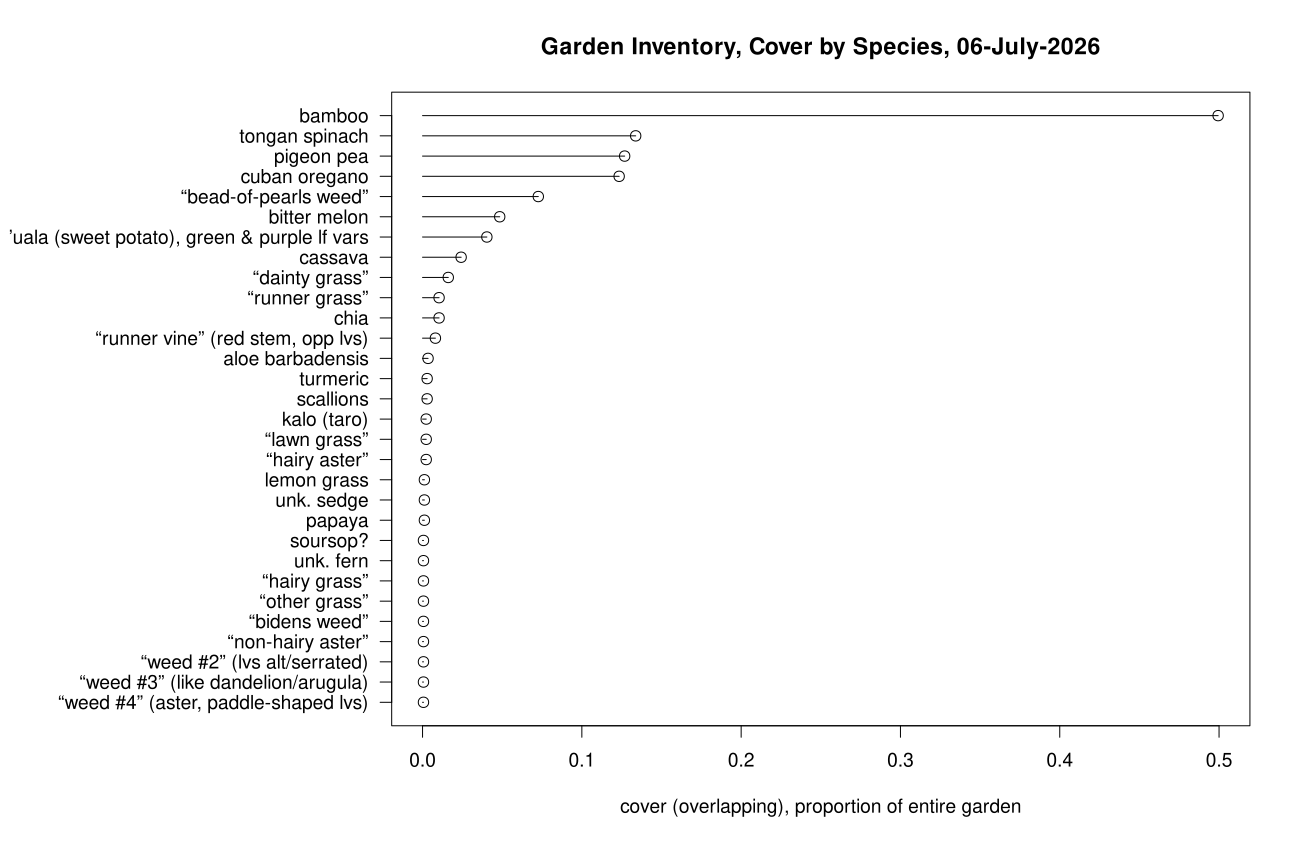
I was surprised by a few things. First was the sheer number of species in a relatively small space: I tallied thirty, and that’s not including the species that fell below my 0.25 square foot threshold. Second was the bamboo cover: I figured it would be the highest one, but I didn’t realize it was covering half of my entire garden. Third, I was surprised by how many graminoid (grass-like) species there were: I counted six graminoid species not counting lemon grass, which I planted intentionally, whereas previously I assumed there were only 2 or 3. I am guilty of not paying much attention to grasses, as I suspect many other botanists are. Beyond the bamboo, there are small handful of species with substantial cover, followed by a long list of species with very minor cover.
Next, I wanted to see the breakdown of cover proportion by species and origin.
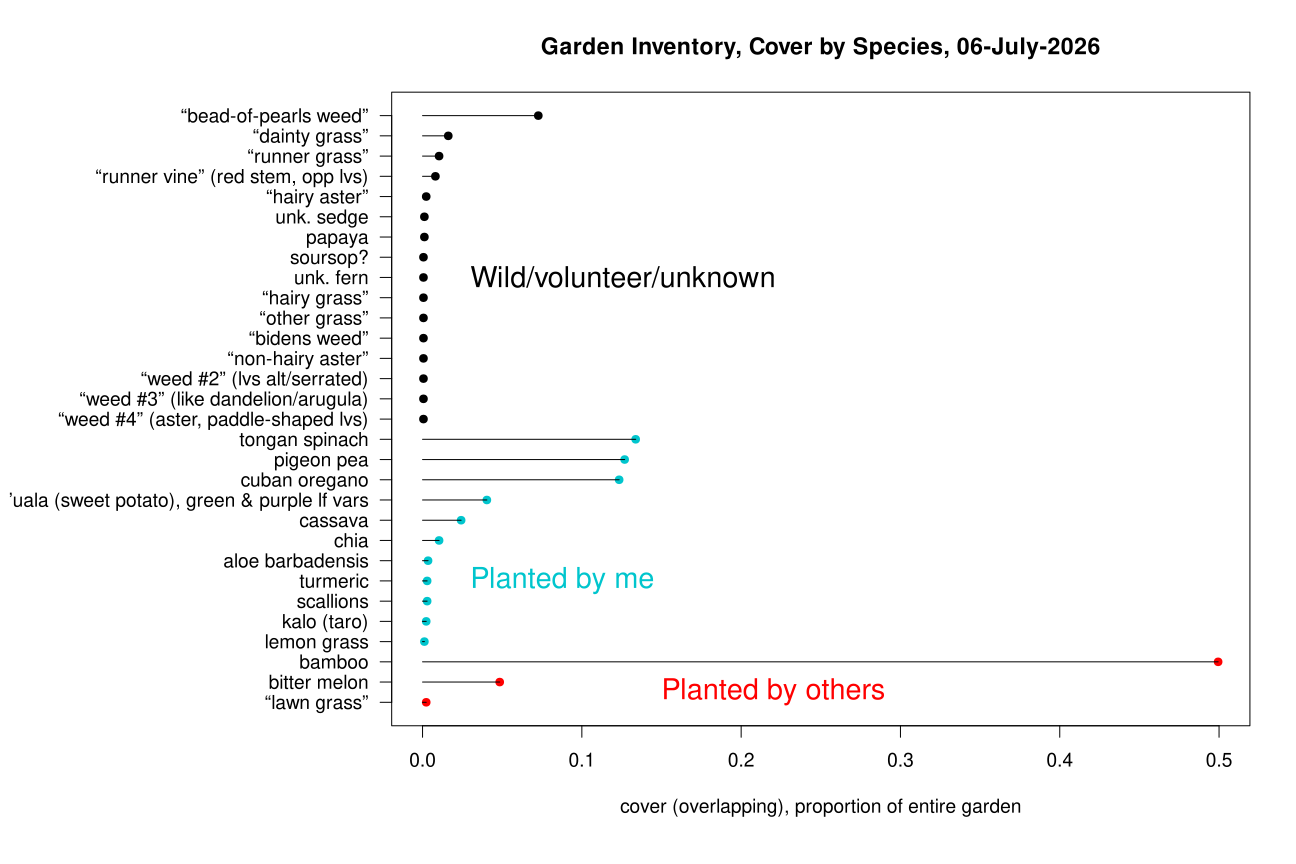
This grouping by origin gives me a better sense of the different influences that have shaped my garden’s current composition.
- There are three species that I know were planted by others before me, and because bamboo is one of them, this is the most dominant category by overall cover.
- Next in terms of cover is the group of species I planted, which contains the most species (3) with at least 10% cover. This is the category that typically comes to mind when I think of the plants in my garden.
- But then there are all the others. This catchall category includes: volunteers (species I unintentionally planted via seeds in compost) like papaya and a tree I suspect is soursop; and species of wild or unknown origin. Although they may be small in terms of cover, they are mighty in numbers. I honestly didn’t realize there were so many species in this category, and I attribute that to the high graminoid diversity that I was previously unaware of.
Taken as a whole, this chart illustrates to me the layered natural history of my small garden, the series of natural forces and decisions made by myself and others that have shaped the plant composition into what it is now.
Closing thoughts
So far, these inventory data give me a better sense of what is there and a preliminary picture of species diversity. But they don’t say much about what it means ecologically or culturally. I am curious to know more about my garden as a system and about how it has changed over time.
In a future article, I plan to build on this dataset and answer such questions by looking at biodiversity indices. I’m also curious to better understand the limitations of ecological interpretations of this dataset, considering the heavy human influence on my garden. I hope you’ll continue to join me along this learning journey.
AI RESPONSIBILITY RUBRIC
This rubric shows human vs AI contribution across stages of developing the article. The rubric was generated by AI and reviewed by Taylan, making adjustments as needed.
--------------------
CONCEPT/PLANNING
Human 70% | AI 30%
[==============......]
The core idea and framing came from the human. AI contributed through iterative dialogue that helped clarify and articulate the conceptual direction.
--------------------
RESEARCH/VERIFICATION
Human 40% | AI 60%
[========............]
AI conducted background research to support methodological and factual decisions in the article. Human contributed existing domain knowledge throughout.
--------------------
DATA COLLECTION/ANALYSIS
Human 100% | AI 0%
[====================]
All field data collection, measurement, data entry, and figure generation were conducted by the human. AI had no role in this category.
--------------------
WRITING
Human 70% | AI 30%
[==============......]
The human drafted the article independently. AI contributed structural guidance that informed the draft. Voice, phrasing, and content decisions are the human's own.
--------------------
EDITING/REFINEMENT
Human 60% | AI 40%
[============........]
The human conducted an initial round of editing prior to AI involvement. AI then performed logical checks and a proofread. Final decisions on all edits remained with the human.
--------------------
IMAGE/FIGURE CREDIT
Human 100% | AI 0%
[====================]
All figures were produced by the human. No AI tools were used in figure creation or design.
--------------------

AI Tools: Claude Sonnet 4.6
Merhaba, Earthy!
Interesting article on the biodiverse garden that you tend! Thank you for sharing! I appreciate your naming of plants … “I assigned each species a name that makes sense to me rather than trying to identify everything to species” As you are aware, I name all kinds of Beings in my world according to what makes sense to me. HA! …and only those who know me well know what or who in the heck I am talking about or with. :o)))).
I have your blog bookmarked and looked it up on the computer, as my eyes don’t do so well on the little phone screens.
May you continue to enjoy the Leafy-Lovlies, Fruiting Bodies and Bloomin’-Beauties in your ‘neck of the world’!
Wild Be,
Lumi