
A couple updates
This article is a continuation of my last article, in which I presented the results of a botanical inventory of my home garden with the goal of analyzing biological diversity. I have two updates of this project.
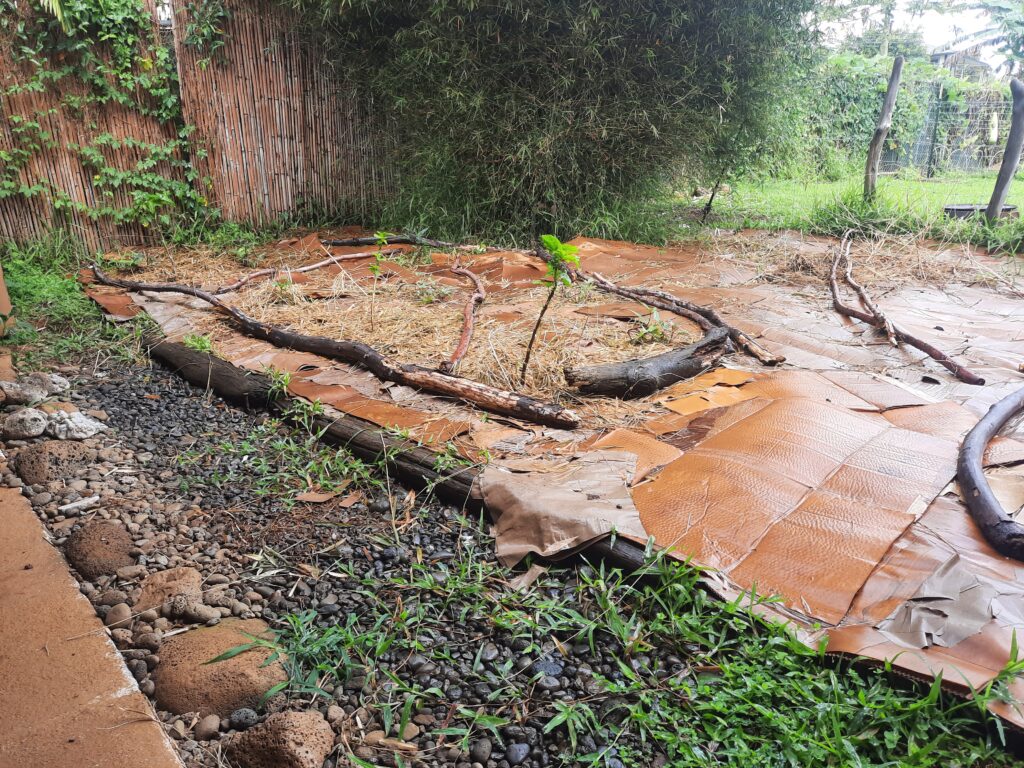
First, this week I generated a historical inventory of plant species and cover percentages for the same plot of land from when I first moved in (i.e., before I started gardening it). I am calling this the “move-in” inventory. This will serve as a point of comparison to the inventory of my garden in its more current state (“current inventory”). I say I “generated” this move-in dataset, because I did this inventory from memory based on my best guess of what was likely there at the time, using the same methodology as in the last article. Because of this reconstruction aspect, the data for the move-in inventory are estimates and are not as precise as those from the measurements I took for the current inventory. But for the purposes of this learning exercise, the estimates are good enough.
Second, I have been reading up on different metrics used in ecology for synthesizing and comparing biodiversity, such as Simpson index, Shannon index, and Hill numbers. I don’t understand these metrics well enough to apply and interpret them yet, so I’ll save that for a future article.
Visualizing species richness and evenness
In the meantime, I want to look at two aspects of biodiversity quantification that I do understand well enough conceptually to talk about: richness and evenness. As I understand it, the various diversity metrics, such as Shannon and Simpson, aim to synthesize these two aspects of diversity into a single number. So I think it’s instructive to take a closer look at richness and evenness, using my garden inventory dataset as an example.
Richness is fairly straightforward: the total number of species. Simply put, a system with more species is richer than one with fewer species.
Evenness is a measure of how evenly distributed all of the species are. A system in which each species is present in similar amounts is more even than one in which a single species is dominant and the remaining species are found in small amounts. As I understand it, evenness is a metric, and I haven’t learned how to calculate it yet. So in this article, I’ll describe what evenness is attempting to capture, without formally calculating an evenness metric.
To illustrate these two concepts, let’s take a look at a chart showing percent cover for each plant species in each inventory.
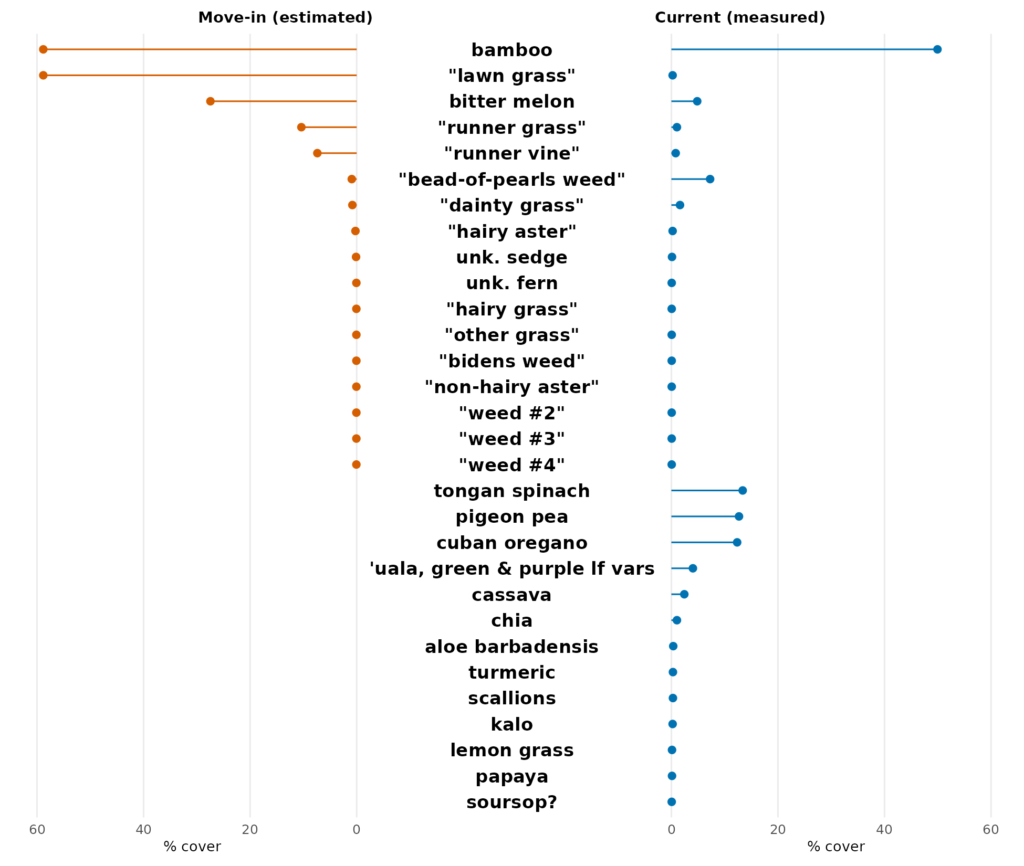
My garden in its current state clearly has more plant species than in its previous, “move-in” state. Thus, my garden is richer in plant diversity now (N = 30 species) than it was when I first moved in (N = 17 species). In that sense, richness has substantially increased. This makes sense: I reduced–but did not eliminate–the abundance of many species that were already there (e.g., the top 5 species at move-in) and added many new species that weren’t there before (i.e., all of the species present in blue but not in orange).
The above assessment assumes that: (1) all “weedy” species (i.e. most of the graminoids and forbs I didn’t plant) currently in my garden were there when I moved in; and (2) no additional “weedy” species were present when I moved in that aren’t present now. I think this is a reasonable assumption given my memory and is good enough for the learning/demonstration purposes of this article.
As for what an evenness metric attempts to capture, I don’t see as clear of a difference just by looking at the graph. The move-in time point has two co-dominant species (bamboo and “lawn grass”) whereas the current time point has only one (bamboo). But beyond that, both time points have a handful of species with substantial cover percentage and a much greater number of species with minimal cover. So just based on this visual assessment of the raw data, I am not sure which time point had a more even distribution of species by percent cover.
Closing
In my experience, it is useful to do exploratory data analysis (EDA) before proceeding with greater levels of data abstraction or synthesis. Case in point: in this article, I compared cover percentages of plant species in my garden at two points in time (i.e., the raw data) by plotting them side-by-side. In doing so, I was able to get a better sense of the comparative species richness and evenness. The next step is to compare plant species diversity between the time points in a more systematic way by using metrics such as Shannon and Simpson indices, which boil down the raw data for each time point to a single number.
In the coming weeks, I’ll be learning more about how to calculate and interpret these metrics, and I’ll report back what I learn. So stay tuned!
AI RESPONSIBILITY RUBRIC
This rubric shows human vs AI contribution across stages of developing the article. The rubric was generated by AI and reviewed by Taylan, making adjustments as needed.
--------------------
RESEARCH/VERIFICATION
Human 30% | AI 70%
======..............
AI conducted literature searches and summarized methodological sources on biodiversity indices and percent-cover data; human directed the research questions, evaluated relevance, and decided what to incorporate.
--------------------
WRITING
Human 75% | AI 25%
===============.....
Human drafted the full article independently, working from an AI-assisted outline, then made a small number of edits for clarity.
--------------------
DATA/VISUALIZATION
Human 55% | AI 45%
===========.........
Human collected both underlying datasets (field measurement and memory-based estimation) and directed all design choices and revisions; AI wrote the data-processing and chart code and produced iterative revisions based on detailed human specifications.
--------------------
EDITING/REFINEMENT
Human 50% | AI 50%
==========..........
AI performed a fact- and logic-verification pass on the completed draft, flagging issues for review, and suggested proofreading edits; human made the final editorial judgment calls and corrections.
--------------------
IMAGE
Human 100% | AI 0%
====================
Featured photo taken independently by the author; no AI involvement.
--------------------

AI Tools: Claude Sonnet 5