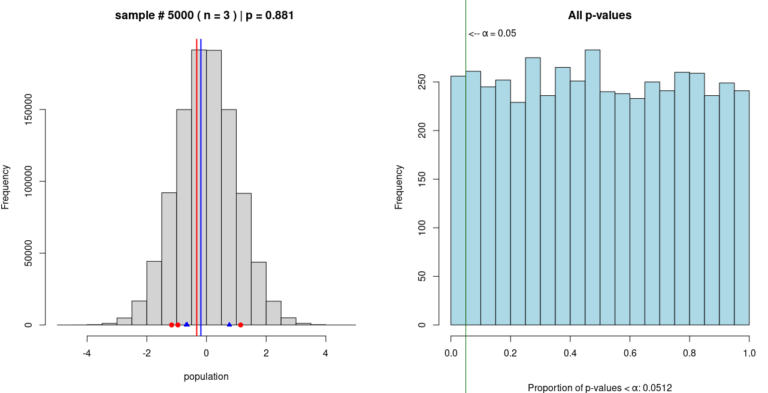
Why doesn't a small p-values automatically prove the alternative hypothesis? In this third article of my series on teaching resources for stats and R, I share a graphical Monte Carlo simulation I developed to teach my students about classical hypothesis testing and p-values.
I created some graphics in R to illustrate the assessment of normality.
In my last article, I explored various national indices. In this article, I explore trends in the dataset for one of those indices--the Happy Planet Index (HPI)--in more depth.
Lately I've been interested in indices of national prosperity, such as the EIU's Democracy Index. These indices represent attempts to quantify different characteristics of a nation's prosperity, such as democracy and peace. Join me on my journey of discovery as I explore these topics!
I analyzed market saturation across various Upwork job categories that I'm considering as my freelance niche. Read on to learn about my thought process, the tools I used, and what I discovered.